Data Services

Data analytics & Visualization

Data science from start to finish -- tidying and processing data, predictive analytics, machine learning and visualization to help you make sense of your data

Interactive Maps & Data Applications

Creating animated maps, data dashboards and visualizations for web & mobile devices to help you explore your data and highlight new insights

Spatial Analysis & Mapping

Specializing in geographic data analysis including GIS, geoprocessing, spatial modeling and spatial data visualization

R/Shiny Applications

Developing Shiny applications and dashboards for biotech companies, non-profits and educational institutions

We love to create custom Mapbox maps

Data Solutions

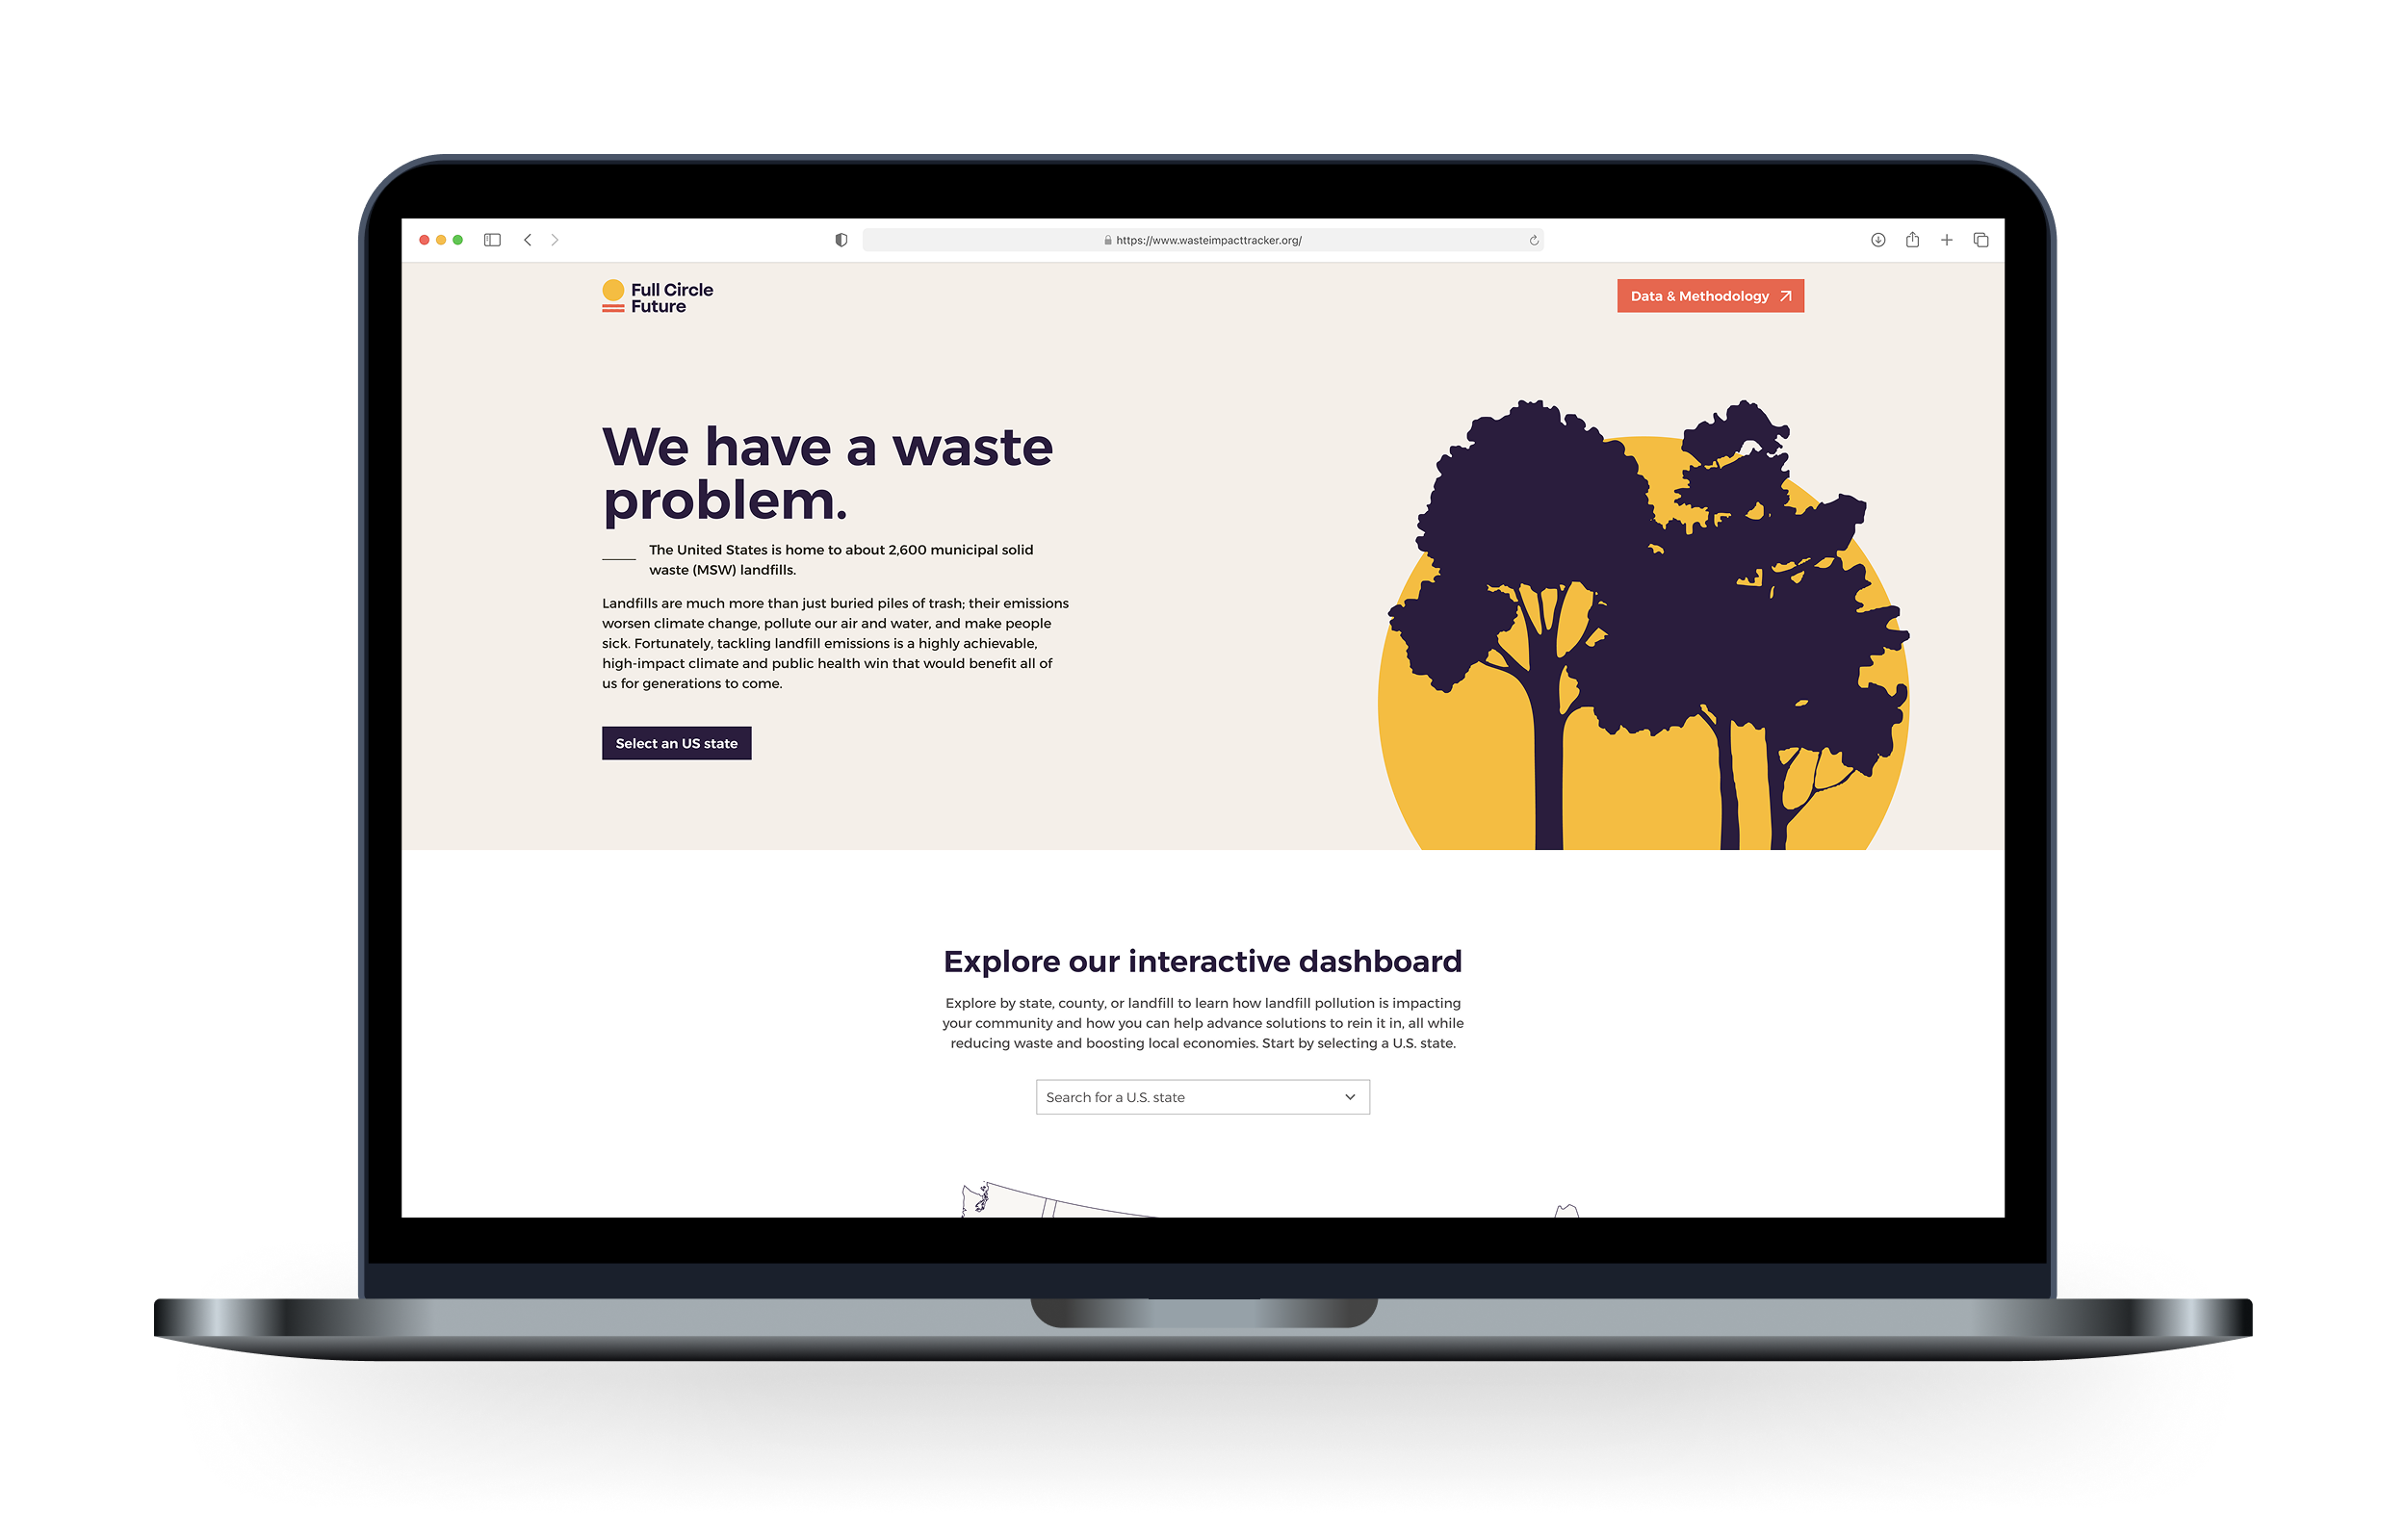
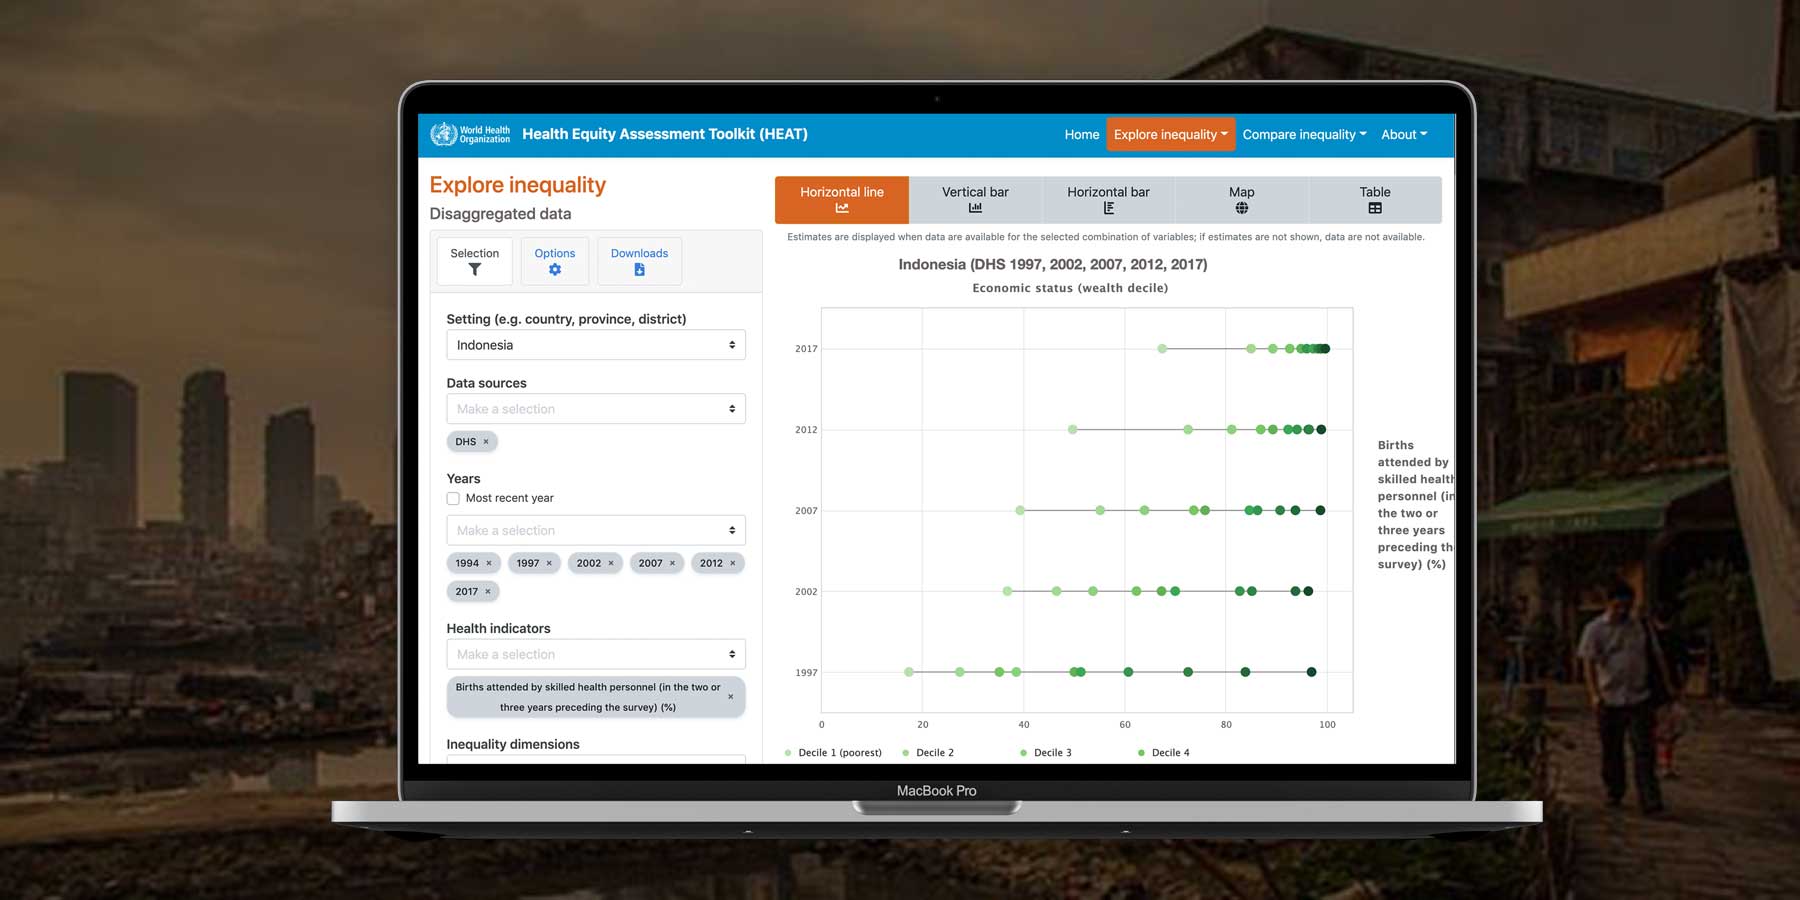
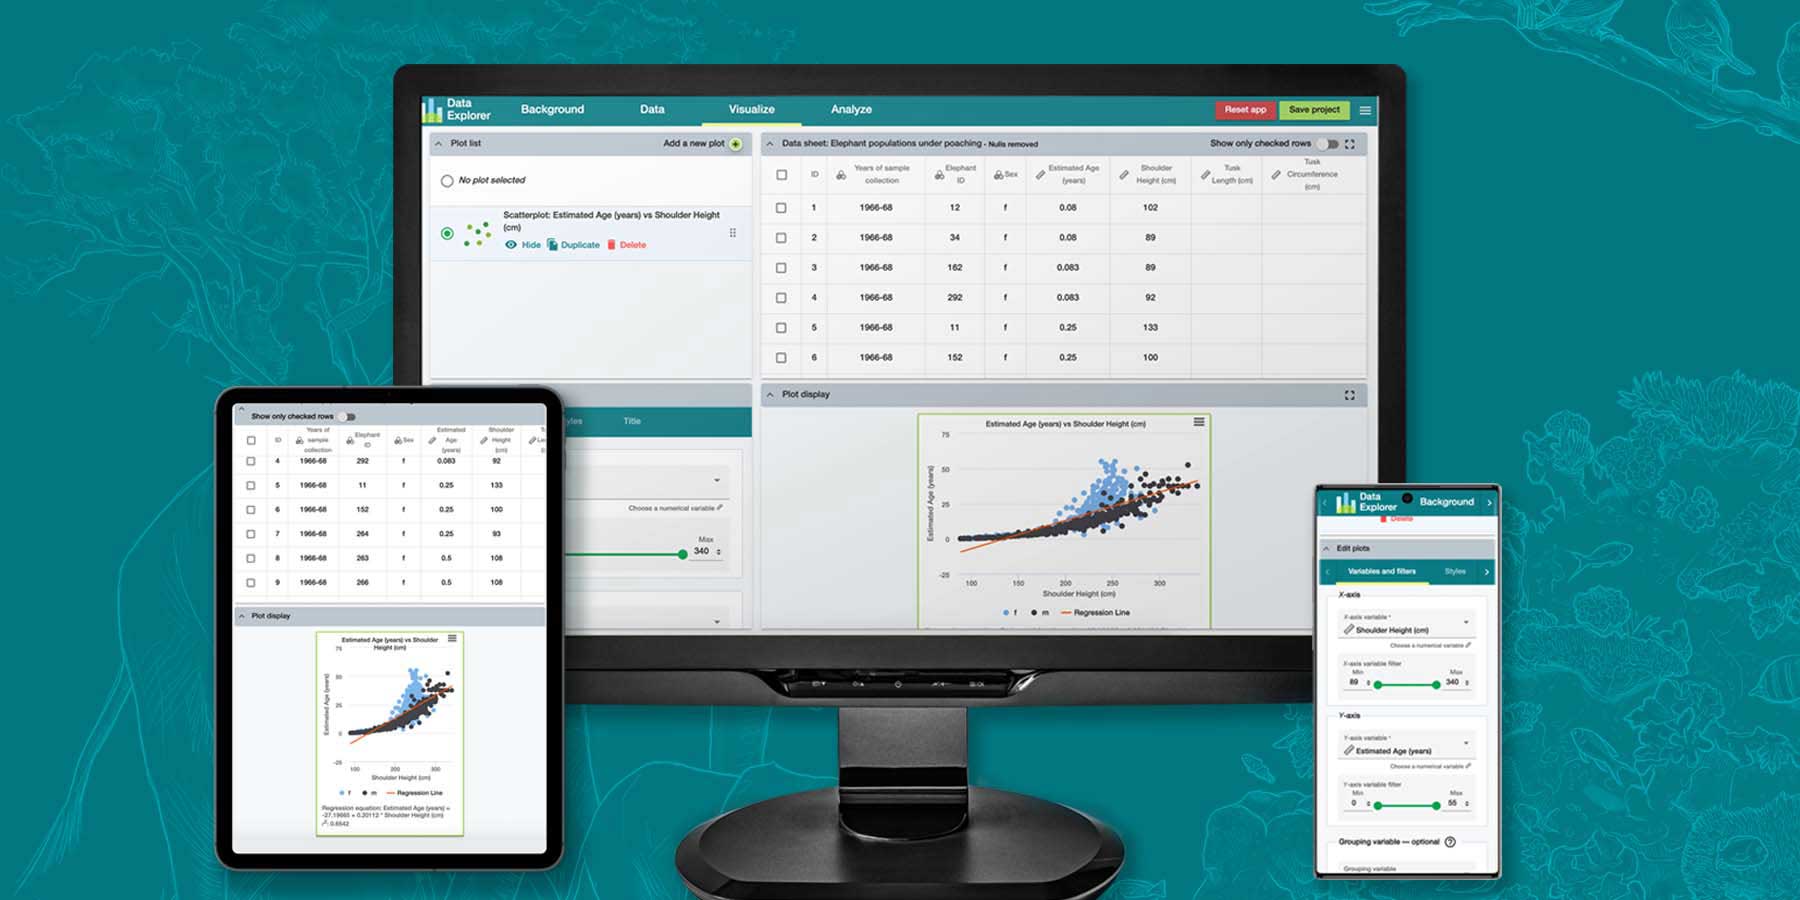
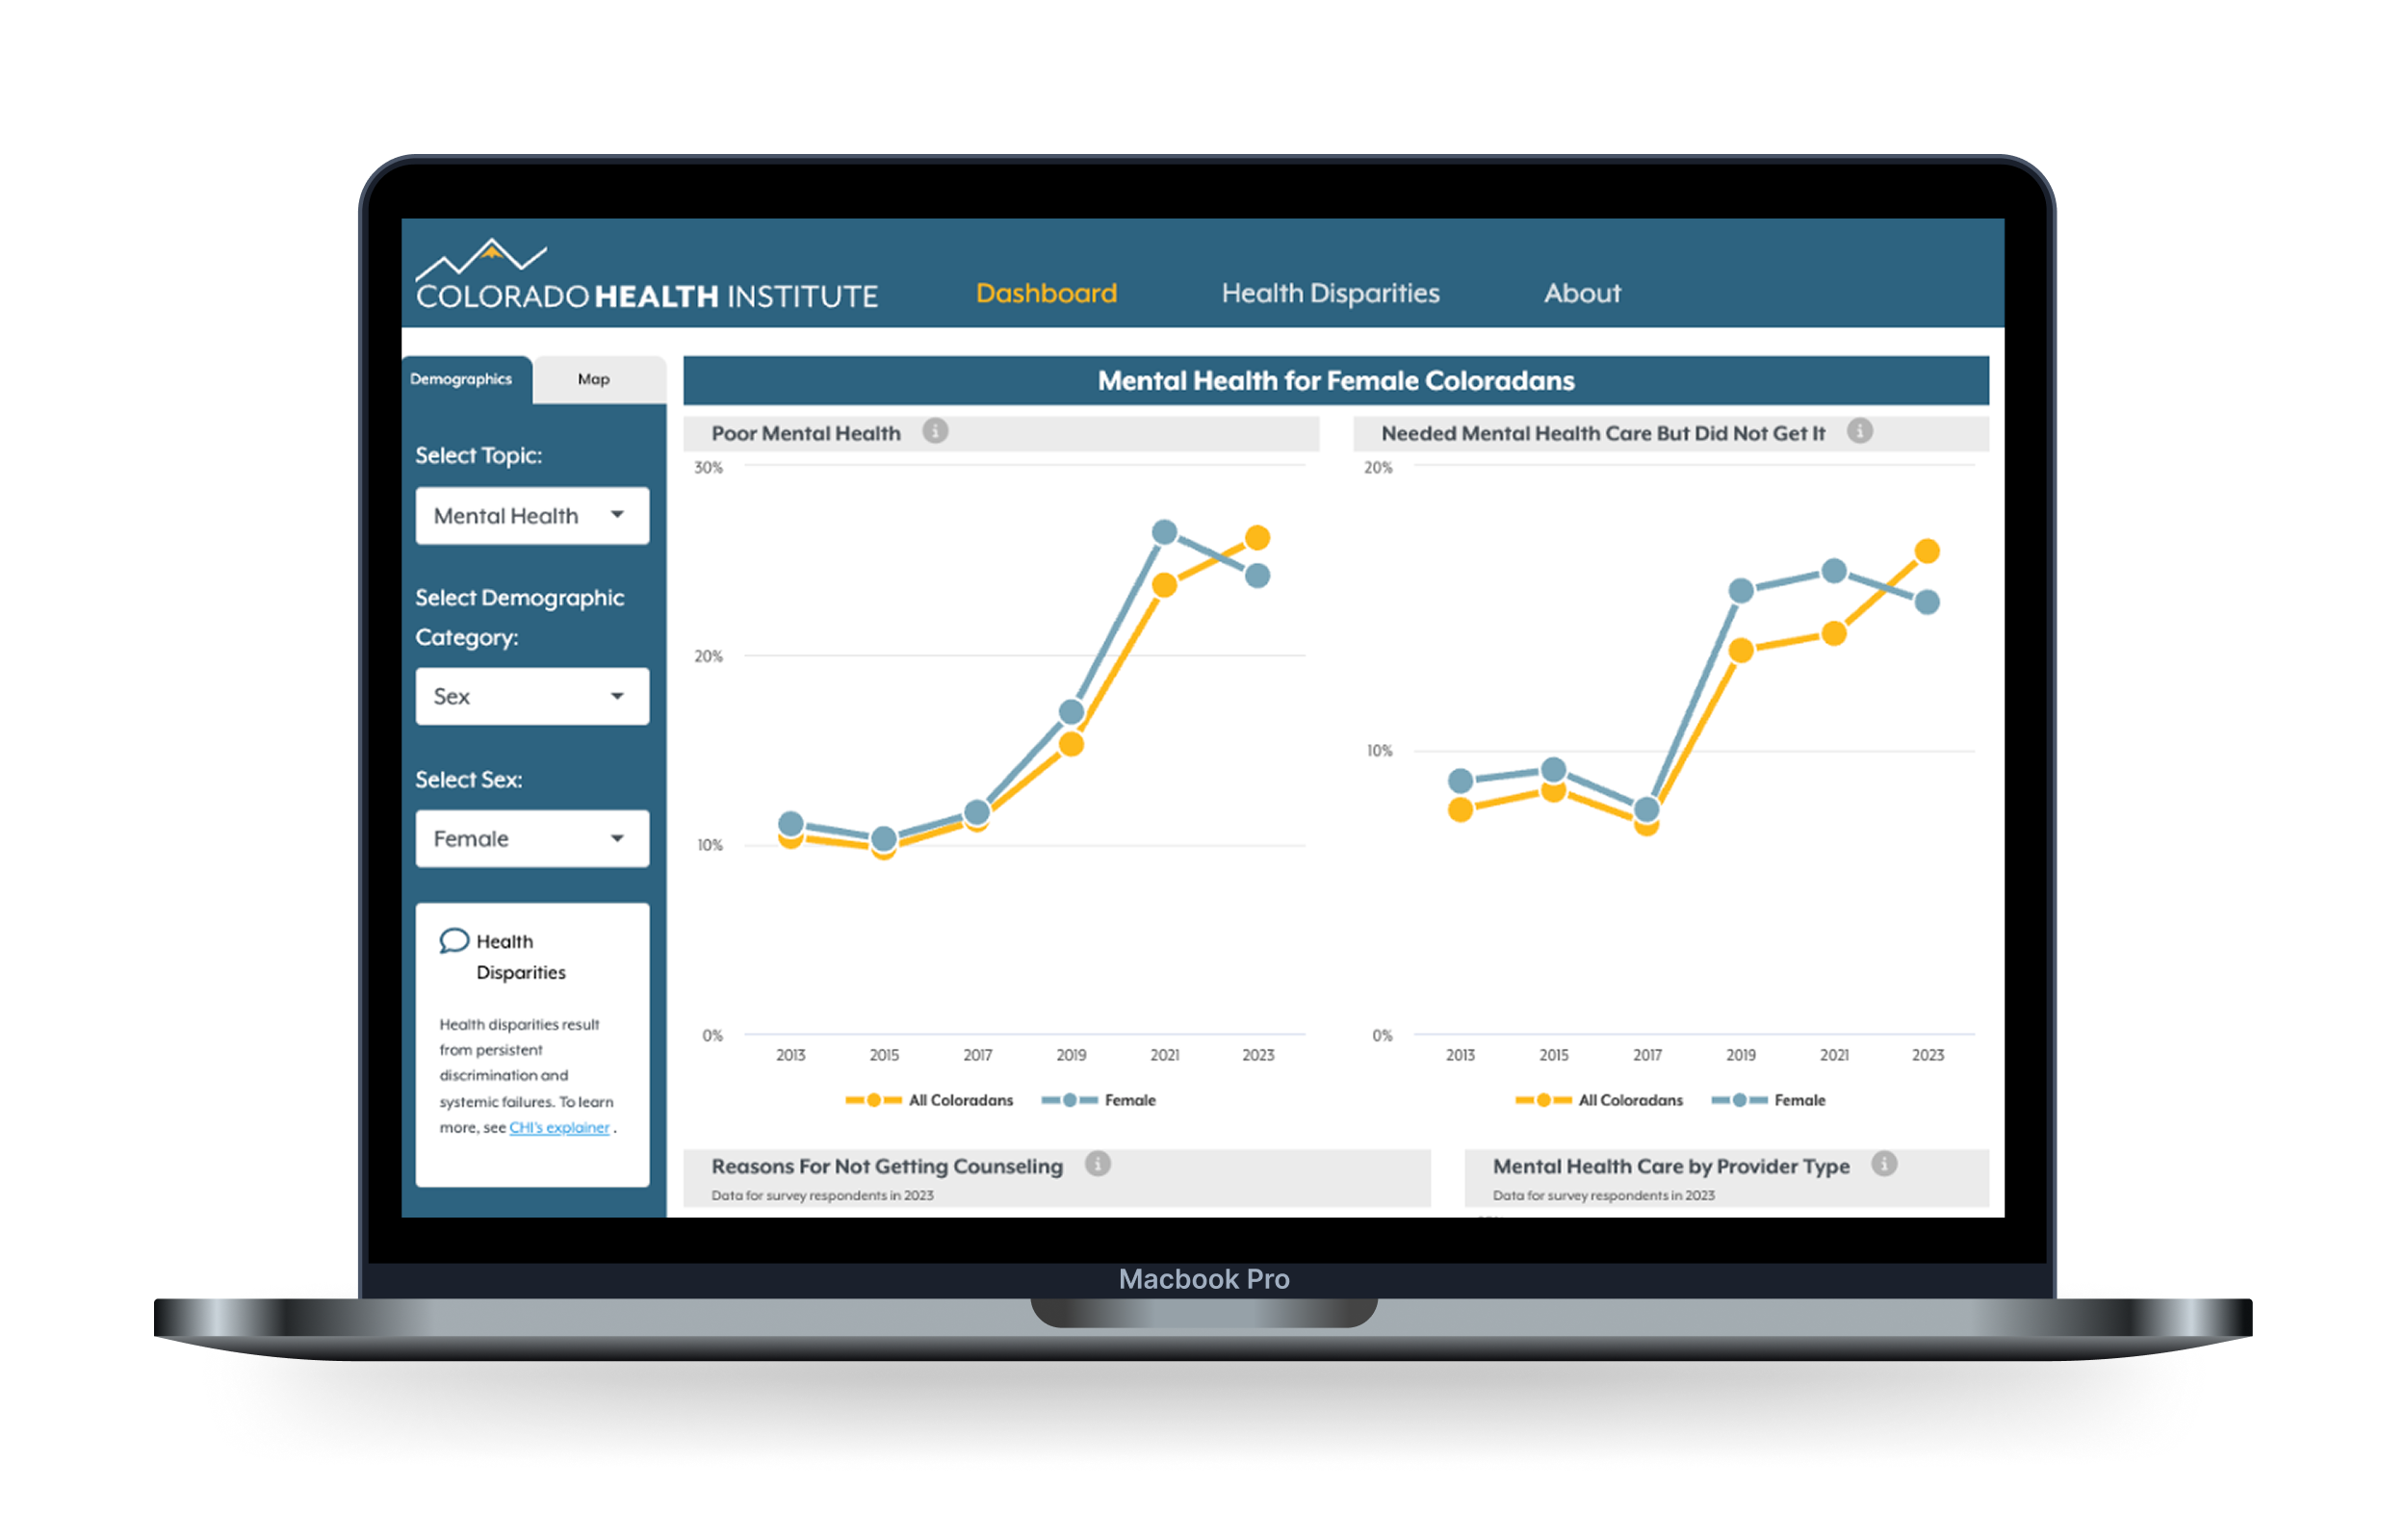
Some Examples of Projects We've Worked On

See how we've helped our clients >

A sample of our clients

What we do

Developers of interactive maps, custom analytics and data visualization.

R, Python, PostgreSQL, PostGIS, React, Mapbox, Highcharts, ArcGIS/QGIS, D3, Shiny, Node.js, Angular, Vue.js

Built with the tools we love

R, Python, PostgreSQL, PostGIS, React, Mapbox, Highcharts, ArcGIS/QGIS, D3, Shiny, Node.js, Angular, Vue.js


learn more about us >