Data visualization platform for the Howard Hughes Medical Institute
A statistics and visualization platform
The project
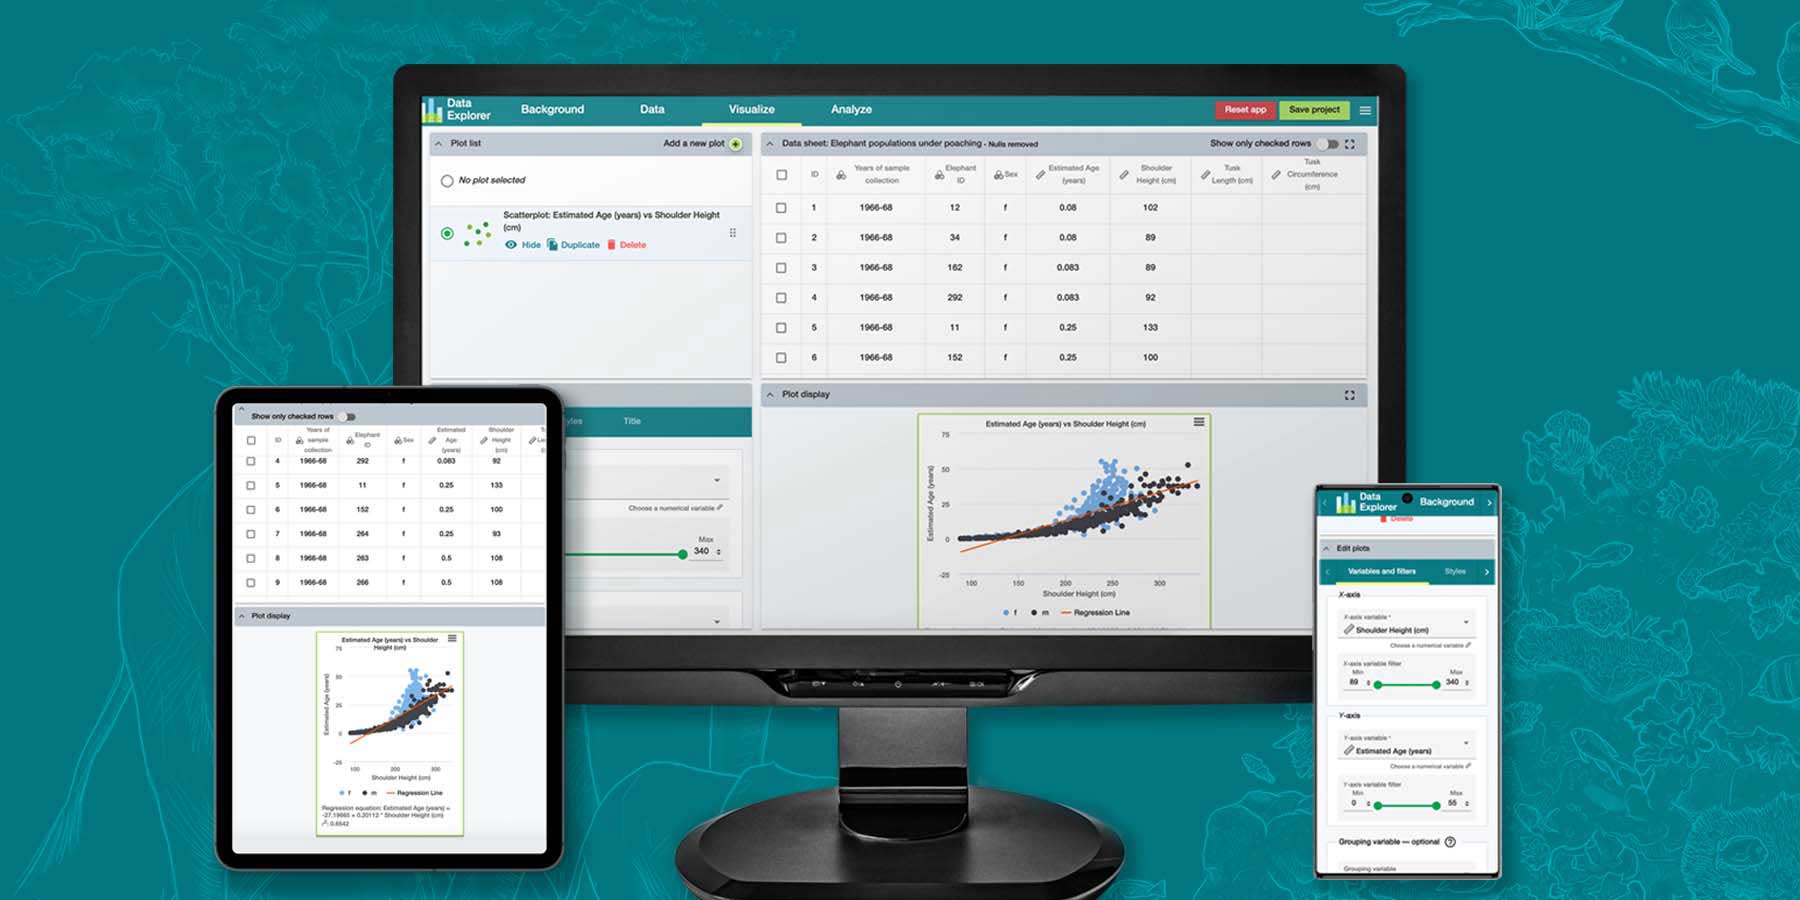
We created Data Explorer, a web tool for quick and easy data analytics and visualization for the Howard Hughes Medical Institute. The tool, designed with students in mind, allows users to quickly generate statistical summaries and a wide range of visualizations. The online application can be found here.
Our role
In collaboration with HHMI we built the tool from start to finish including integration of the statistical libraries jStat and Simple Statistics and development of five different charting options for users using Highcharts. The application allows users to download both data and application status allowing them to resume progress on any computer/any browser.
Features of the work
- Created an easy to use, no installation required, statistical analysis tool for university students
- Integrated several leading JavaScript statistical libraries to provide advanced analyses not usually available outside of professional statistical software
- Used in-browser storage (IndexedDb) and Redux inspired state management to provide a desktop like experience, with all projects saved locally and exportable for future use
- Included the ability to upload and analyze any user-generated dataset
Tools used

Angular

Highcharts

Typescript

D3
Made for