Data-driven web map for the National Resource Defense Council
Climate Change and Health
The project
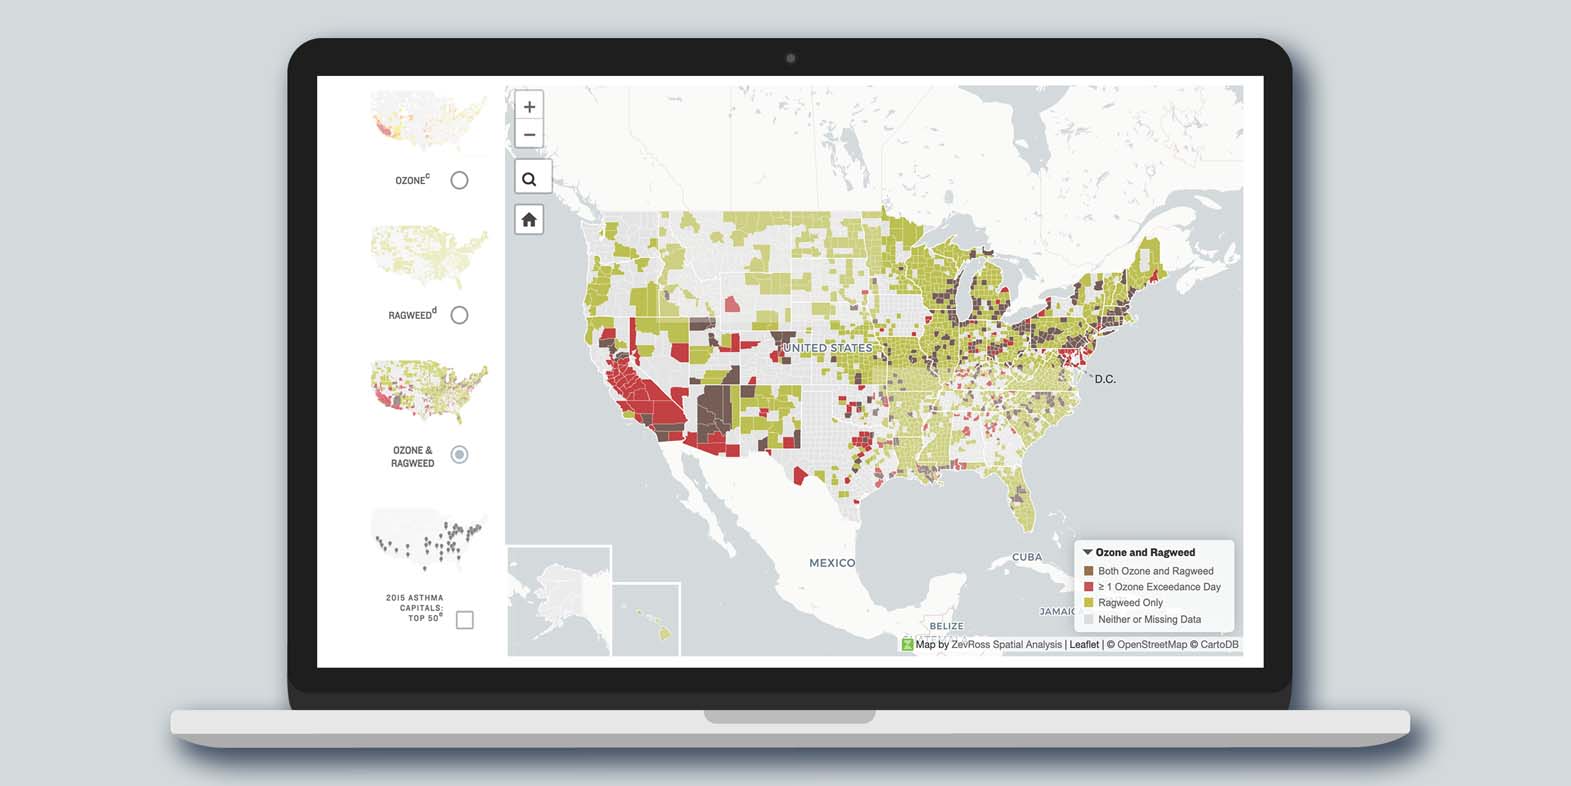
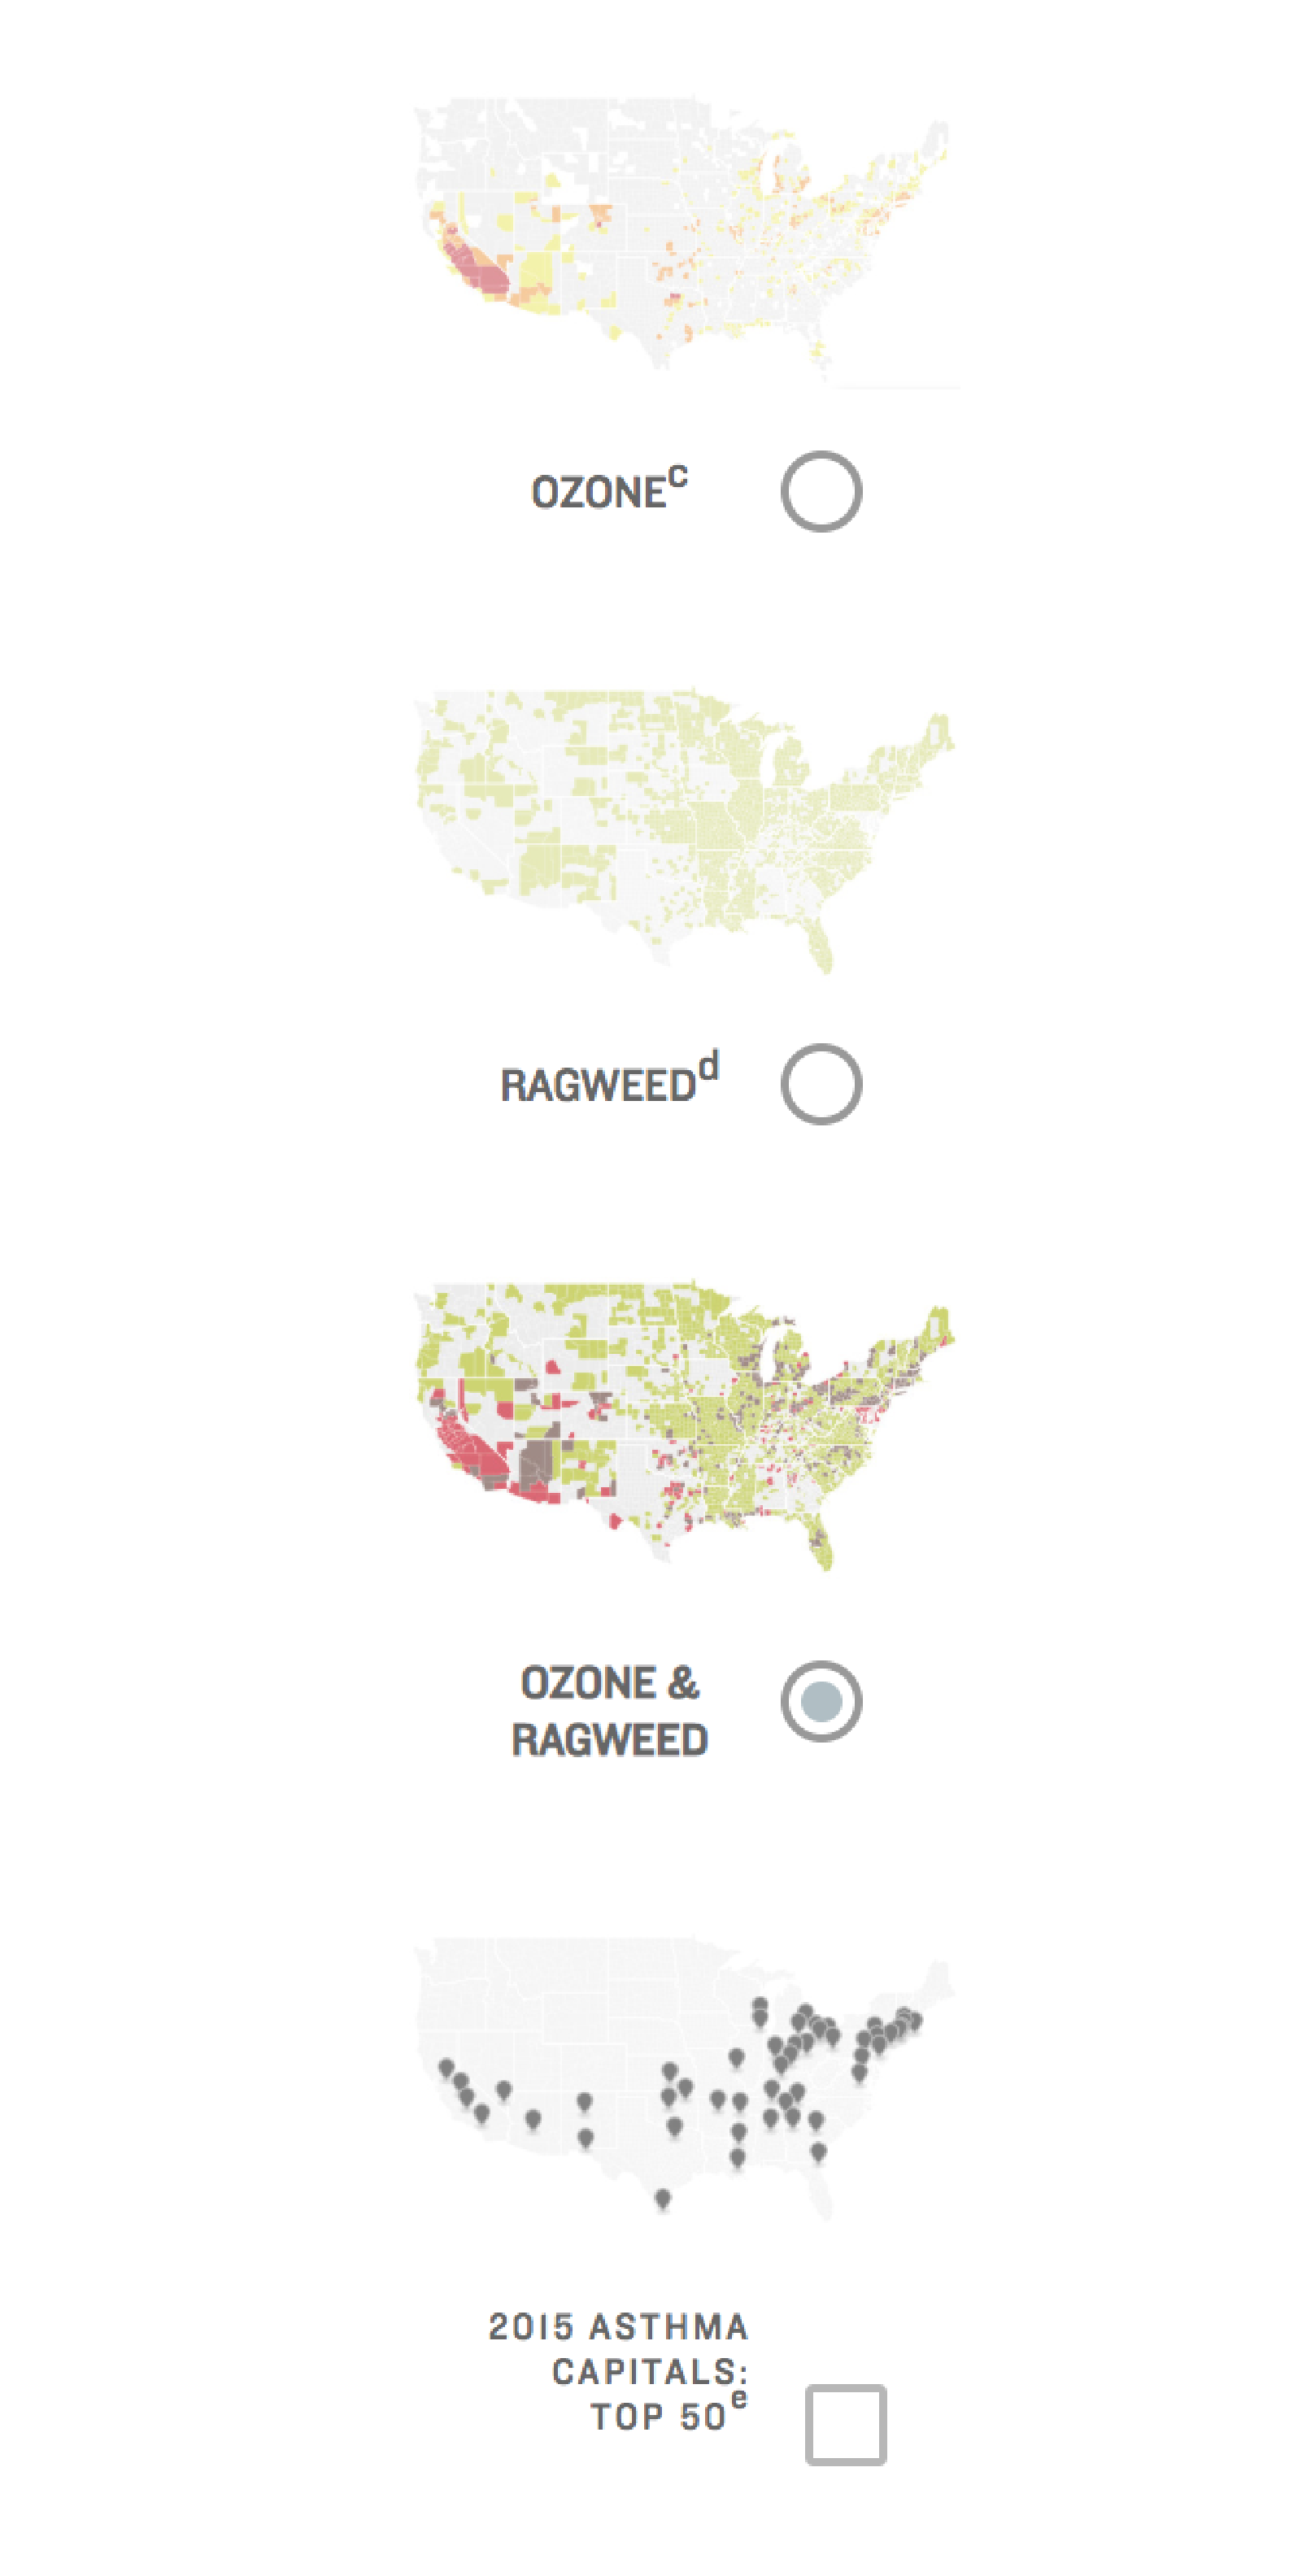
This unique mapping application highlights exposure to ozone air pollution and ragweed pollen as well as the 50 cities most affected by asthma. Clicking on a state brings up state-level statistics and a county-level map.
Our role
We built a custom mapping application that seamlessly fit into the client's existing website and infrastructure. The application dynamically updates as Natural Resources Defense Council staff update content using GitHub. In addition to building the mapping application itself, we were responsible for the full life cycle of air quality data collection, processing and statistics.
Features of the work
- We used the Leaflet JavaScript library for mapping, and Topojson for the large geographic layers
- Edits to the site content are made in GitHub and updates are dynamic
- Built using Angular and Typescript, and features deep linking directly to a state
Tools used

R

Python

ArcGIS/QGIS

PostgresSQL

PostGIS
Made for